
Did you know that 69% of your website content never gets seen by your visitors?
Users come to your website but don’t fully engage, bounce away, or don’t discover your hard work. That results in fewer call-to-actions clicks and ultimately lower sales.
The question is why do your customers leave?
If you sit and stare at Google Analytics and wonder where the problem lies then you’re not alone. The good news is that website marketers have discovered a way to record everything their visitors do.
The technology is called heatmaps. And it will completely change how you develop your website in the future.
This article explains what a heatmap is and gives 5 major reasons to use them.
Learn the different types of heatmaps and their functions. Discover heatmap uses and their benefits.
Read on to see how the system can enhance your website by visually analyzing how your customers interact with it.
What Are Heatmaps?
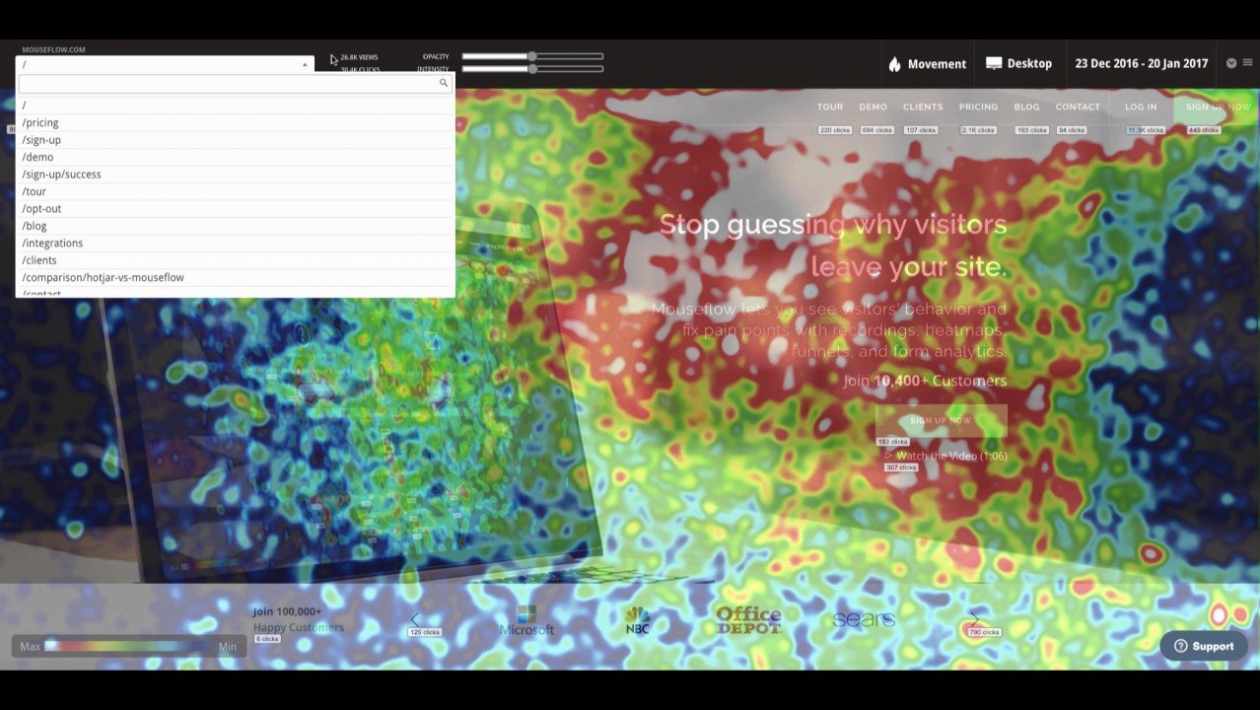
A heatmap acts as a data visualization tool so businesses can see how users interact with their website.
Different colors donate areas of engagement. Warmer colors indicate high levels of usage while the coolest show low levels. That means you can see what parts of the page gather the most interest including taps and clicks, swipes, and scrolls.
Types of Heatmaps
There are several variations of heatmaps available to track user behavior:
- Click Maps – highlights parts of the page that are clicked or tapped
- Scroll Maps – how far down the page the user scrolls
- Mouse Tracking – shows the path of the user’s mouse on the page
- Eye Tracking – advanced heatmaps functions that record the user’s eye movement
Each offers greater insight into what a customer does and gives hints as to why.
For example, a mouse tracking heatmap showing sporadic movements evidence confusion. A click map of a user trying to click an image thinking it’s a link suggests you should add one.
Heatmap Functions
Click maps often highlight key interactable elements on the page like buttons, links, and images. They show what the customer thought was clickable and can pinpoint if they engaged with a CTA or call-to-action.
Scroll maps relay how far customers are willing to scroll down a page before giving up. They also show areas of interest and where you should place CTAs.
Mouse tracking records all of the user’s mouse movements.
Actions get recorded in real-time so you can play them back whenever you wish. These videos provide a fascinating insight into your customers’ minds. And you don’t need an expensive focus group to create them.
How to Use a Heatmap
Adding heatmaps to your website is relatively simple if you choose the right provider.
They will issue you a tracking code to add to the bottom of each page of your website. This works in the same way as Google Analytics and other tracking tools.
Information’s saved automatically in the background when new visitors arrive on your site. You can then access the heatmaps on the provider’s dashboard and review them as you wish.
Reasons for Using a Heatmap
Below are 5 major reasons to add heatmap functionality to your website or eCommerce store.
Each highlights the main heatmap uses and heatmap functions that make the tool so popular amongst marketers. From instant visual analysis to filtering results, you can see what’s happening online just like in an offline store.
- Instant Page Analysis
Unlike normal statistical charts, heatmaps provide an instant visual analysis of the data.
The simple color scheme makes it easy to ascertain the different parts of the page that perform well. Areas in red, orange and yellow receive the most attention while blues and greens lie dormant.
As the data gets recorded on a continual basis, you can access results immediately.
A/B testing is now a viable solution in real-time. Changes that you make to your site will appear in your heatmap data within seconds. That way you can quickly check if new updates offer a different outcome.
And if they don’t then edit them and test again!
- Heatmaps Display Full User Behavior
Not only do heatmap functions cover scrolling and clicking but they also record your customer’s website journey.
You can see what a user does when they arrive on your landing pages. Follow their actions as they interact with the content and navigate to another page. Discover if they follow your CTA or leave in frustration.
Eliminate the guesswork by using a heatmap.
- Filter and Segment Results
The top heatmap providers provide full filtering of the results. You can specify metrics like:
- Date ranges
- Devices types
- Screen sizes
- User history
Segmenting these stats helps pinpoint issues amongst certain groups. For example, if you see poor take-up amongst tablet users, heatmaps for that group can explain why.
- Target Multiple Devices and Browsers
Heatmaps work on any modern device and browser. You don’t need to implement complex code if your customer has an iPhone or a low-spec PC.
Information flows into the data pool and enables you to view heatmaps for a specific device or browser type. You can even implement them into a mobile app for a broader marketing perspective.
- Highlight Popular and Unpopular Elements
Heatmaps are an excellent tool to highlight problem areas as they record digital body language cues.
Multi-clicks, device rotation, and erratic mouse movements (bird’s nests) indicate a poor UX. Double-clicking content also reflects frustration as does halfway scrolling and page zooming.
On the plus side, you can easily spot the things you’re doing right.
If you have a navigation system that makes sense then your customers will interact with it. If your eCommerce add-to-cart buttons are easy to spot then a heatmap will show this.
Heatmaps record it all and are an essential tool for businesses that are serious about improving CX.
More Tips for Using a Heatmap
Heatmaps let you visualize your customers’ journeys as they interact with your website.
You can easily spot which elements they click or tap on and the problem areas of your navigation. The video replay analysis tools are an excellent way to see how real people use your website and the issues they encounter.
Add heatmaps to your website to receive instant feedback. You’ll gain access to a full range of heatmap functions that will shape the future of your online presence.
Read more tips for using a heatmap in our other tech articles.
Remember to bookmark the site as we add new posts on a regular basis. And please share this article on how to use a heatmap on social media.